PAST Rx – Features
PASTRx Runs on Tablets & Computers
PASTRx is a Web application, and runs on a computer or tablet with Internet access via the current version of: Internet Explorer, or Chrome.
PASTRx is SaaS
PASTRx is a subscription service, offered as a stand-alone application or as part of a web-based Interactive ‘Dashboard’ combining the analyzed PDMP data and map with client-selected elements from their EHR (click here to learn more about the Dashboard).
- Clients enter their credentials and the required information on the patient for whom a report is sought in PASTRx the same way they enter them now in their state’s system.
- We pass those credentials and patient data to the state and retrieve the patient data from the PDMP
- Without the ability to view that HIPAA protected data, our patent pending algorithms analyze and interprets the raw data
- A number of important Alerts are derived, some of which have client-defined thresholds, and highlighted on the 1st page of the report.
- We apply CDC data to calculate and chart MED
- We apply geographic tagging to the addresses of all prescribers and dispensing pharmacies
- We produce, and return to the requesting provider, the graphic interpretation of analyzed PDMP data shown above … more details below.
- An interactive map displays the locations of prescribers, pharmacies and patient’s address for immediate recognition of potential issues.
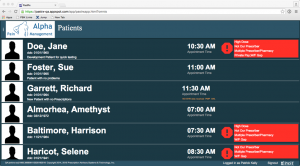
The PASTRx Patient List
[su_row]
[su_column size=”1/3″]
[/su_column]
[su_column size=”2/3″]
- Rather than a simple list, the PASTRx report immediately presents the graphical visualized interpretation of our analyzed PDMP data
- A line chart of daily dosages of all prescribed and dispensed medications over a client-defined time-period:
- MEDs of opioids, with overlaps quickly seen
- Benzodazapines
- Stimulants
- Chart displays overlaps of reported prescriptions
- A list of MEDs over time
- Two line charts displaying number of CS prescribers and number of pharmacies over the same client-defined time period, with red alerts if more than five of either
- A list of current active prescriptions
- The source PDMP raw data report can be viewed and/or printed
[/su_column]
[/su_row]
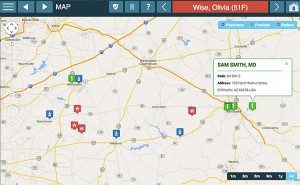
The PASTRx Map
[su_row]
[su_column size=”1/3″]
[/su_column]
[su_column size=”2/3″]
- The map displays icons of all the patient’s pharmacies and prescribers of Controlled Substances in the state PDMP, ‘sized’ accordingly.
- Immediately recognize patterns that suggest the patient might be “pharmacy shopping” and/or “doctor shopping” without the need to be familiar with the written addresses.
- The map presents with the common capabilities of zooming in and out, helping the provider pinpoint locations.
- The map is interactive, with mouse-over the icons displaying the name and address of every pharmacy and prescriber, as well as the patient’s address in the PDMP.
[/su_column]
[/su_row]
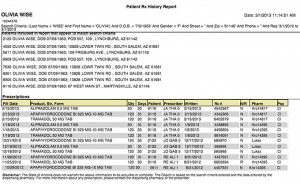
State PDMPs are Difficult to Interpritate
[su_row]
[su_column size=”1/3″]
[/su_column]
[su_column size=”2/3″]
- This is an example of a PDMP report (as produced in most states)
- It has proven a challenge for prescribers to derive the needed Clinical Decision Support on the smaller percentage of new patients, even established patients, with a lot of data.
- Those are the very patients who might be at risk and might be placing the prescriber at risk.
- How easy is it to determine if the patient might be “pharmacy or doctor shopping”?
- How easy is it to determine if the patient is unaware they are at risk of overdose?
- How easy is it to calculate overlaps and MED?
- How easy is it to dig out all the questions to ask the patient?
- It isn’t.
- PASTRx is, simply, a faster, easier, better way.
[/su_column]
[/su_row]